Monitoring Workflows
This document describes how to deploy and configure Prometheus and Grafana components for monitoring of SonataFlow workflows.
|
Currently, only those SonataFlow workflows deployed as Kubernetes deployments have workflow related metrics exposed to Prometheus and are hence available for monitoring by Grafana Dashboards. Monitoring of SonataFlow workflows deployed as Knative services is not supported and such serverless workflows are not included in the Grafana Dashboards. |
Deploy Prometheus and Grafana
Deploy Prometheus and Grafana on OpenShift Container Platform
Deploy Prometheus
OpenShift Container Platform includes a preconfigured, preinstalled, and self-updating monitoring stack that provides monitoring for core platform components. As such the Prometheus Operator is already installed on the cluster. To monitor SonataFlow workflows, you shall enable monitoring for user-defined projects. This is achieved by updating cluster-monitoring-config ConfigMap in the openshift-monitoring namespace. Create a new one if the ConfigMap does not exist.
cat << EOF | oc apply -f -
apiVersion: v1
kind: ConfigMap
metadata:
  name: cluster-monitoring-config
  namespace: openshift-monitoring
data:
  config.yaml: |
    enableUserWorkload: true
EOF
A new Prometheus server pod will be started and running in the namespace openshift-user-workload-monitoring.
Deploy Grafana
Deploy Grafana Operator
Create a namespace for the Grafana Operator to be installed in
oc new-project grafana-operatorDeploy the Grafana Operator using command line. You can also deploy the operator through OperatorHub.
cat << EOF | oc create -f -
apiVersion: operators.coreos.com/v1
kind: OperatorGroup
metadata:
  generateName: grafana-operator-
  namespace: grafana-operator
spec:
  targetNamespaces:
  - grafana-operator
---
apiVersion: operators.coreos.com/v1alpha1
kind: Subscription
metadata:
  generateName: grafana-operator-
  namespace: grafana-operator
spec:
  channel: v5
  name: grafana-operator
  installPlanApproval: Automatic
  source: community-operators
  sourceNamespace: openshift-marketplace
EOF
Wait for the Operator to be ready
oc -n grafana-operator rollout status \
  deployment grafana-operator-controller-manager-v5
Deploy Grafana Instance
cat << EOF | oc create -f -
apiVersion: grafana.integreatly.org/v1beta1
kind: Grafana
metadata:
  name: grafana
  labels:
    dashboards: "grafana"
spec:
  config:
    security:
      admin_user: root
      admin_password: secret
EOF
Give the Grafana service account the cluster-monitoring-view role
oc adm policy add-cluster-role-to-user cluster-monitoring-view -z grafana-saDeploy the Prometheus Data Source
cat << EOF | oc create -f -
apiVersion: grafana.integreatly.org/v1beta1
kind: GrafanaDatasource
metadata:
  name: example-grafanadatasource
spec:
  datasource:
    access: proxy
    isDefault: true
    type: prometheus
    jsonData:
      httpHeaderName1: 'Authorization'
      timeInterval: 5s
      tlsSkipVerify: true
    secureJsonData:
        httpHeaderValue1: 'Bearer ${TOKEN}'
    name: Prometheus
    url: https://thanos-querier.openshift-monitoring.svc.cluster.local:9091
  instanceSelector:
    matchLabels:
      dashboards: grafana
EOF
Wait until the Grafana server is ready.
oc wait --for=condition=Available=True deployment/grafana-deploymentDeploy Prometheus and Grafana on Kubernetes
Deploy Prometheus
Deploy Prometheus Operator
PROMETHEUS_VERSION=v0.70.0
kubectl create -f https://github.com/prometheus-operator/prometheus-operator/releases/download/${PROMETHEUS_VERSION}/bundle.yaml -n default
Wait until the operator is ready.
kubectl wait --for=condition=Available=True deploy/prometheus-operator -n defaultDeploy Prometheus Instance
cat << EOF | kubectl create -n default -f -
apiVersion: monitoring.coreos.com/v1
kind: Prometheus
metadata:
  name: prometheus
spec:
  serviceAccountName: prometheus
  serviceMonitorNamespaceSelector: {}
  serviceMonitorSelector: {}
  podMonitorSelector: {}
  resources:
    requests:
      memory: 400Mi
---
apiVersion: v1
kind: ServiceAccount
metadata:
  name: prometheus
---
apiVersion: rbac.authorization.k8s.io/v1
kind: ClusterRole
metadata:
  name: prometheus
rules:
- apiGroups: [""]
  resources:
  - nodes
  - nodes/metrics
  - services
  - endpoints
  - pods
  verbs: ["get", "list", "watch"]
- apiGroups: [""]
  resources:
  - configmaps
  verbs: ["get"]
- apiGroups:
  - networking.k8s.io
  resources:
  - ingresses
  verbs: ["get", "list", "watch"]
- nonResourceURLs: ["/metrics"]
  verbs: ["get"]
---
apiVersion: rbac.authorization.k8s.io/v1
kind: ClusterRoleBinding
metadata:
  name: prometheus
roleRef:
  apiGroup: rbac.authorization.k8s.io
  kind: ClusterRole
  name: prometheus
subjects:
- kind: ServiceAccount
  name: prometheus
  namespace: default
EOF
Wait until the Prometheus server is ready.
kubectl apply -f ./test/testdata/prometheus.yaml -n default
kubectl wait  --for=condition=Available=True prometheus/prometheus -n default
Deploy Grafana
Deploy Grafana Operator
GRAFANA_VERSION=v5.13.0
kubectl create -f https://github.com/grafana/grafana-operator/releases/download/${GRAFANA_VERSION}/kustomize-cluster_scoped.yaml
Wait until Grafana Operator is ready.
kubectl wait --for=condition=Available=True deploy/grafana-operator-controller-manager -n grafanaDeploy Grafana Instance
cat << EOF | kubectl create -n default -f -
apiVersion: grafana.integreatly.org/v1beta1
kind: Grafana
metadata:
  name: grafana
  labels:
    dashboards: "grafana"
spec:
  config:
    security:
      admin_user: root
      admin_password: secret
EOF
Create a Grafana Datasource for Prometheus
cat << EOF | kubectl create -n default -f -
apiVersion: grafana.integreatly.org/v1beta1
kind: GrafanaDatasource
metadata:
  name: example-grafanadatasource
spec:
  datasource:
    access: proxy
    type: prometheus
    jsonData:
      timeInterval: 5s
      tlsSkipVerify: true
    name: Prometheus
    url: http://prometheus-operated.default.svc.cluster.local:9090
  instanceSelector:
    matchLabels:
      dashboards: grafana
EOF
Wait until the Grafana server is ready.
kubectl wait --for=condition=Available=True deployment/grafana-deployment -n defaultOpen Grafana Dashboard UI
Now you can forward local port number 3000 to the Grafana service.
kubectl port-forward svc/grafana-service -n default 3000:3000Open Grafana Dashboard UI in your web browser with the URL http://localhost:30000. Log in using with admin user name root and passward secret.
Workflows Monitoring
Enable monitoring in SonataFlowPlatform CR
When SonataFlowPlatform CR has spec.monitoring.enabled set, and Prometheus has been deployed in the cluster, SonataFlow Operator will automatically create a service monitor for each workflow that is deployed as a Kubernetes Deployment object. The service monitor allows Prometheus to scrape the workflow related metrics from the workflow pod.
apiVersion: sonataflow.org/v1alpha08
kind: SonataFlowPlatform
metadata:
  name: sonataflow-platform
spec:
  monitoring:
    enabled: true
Test Data Source Connection
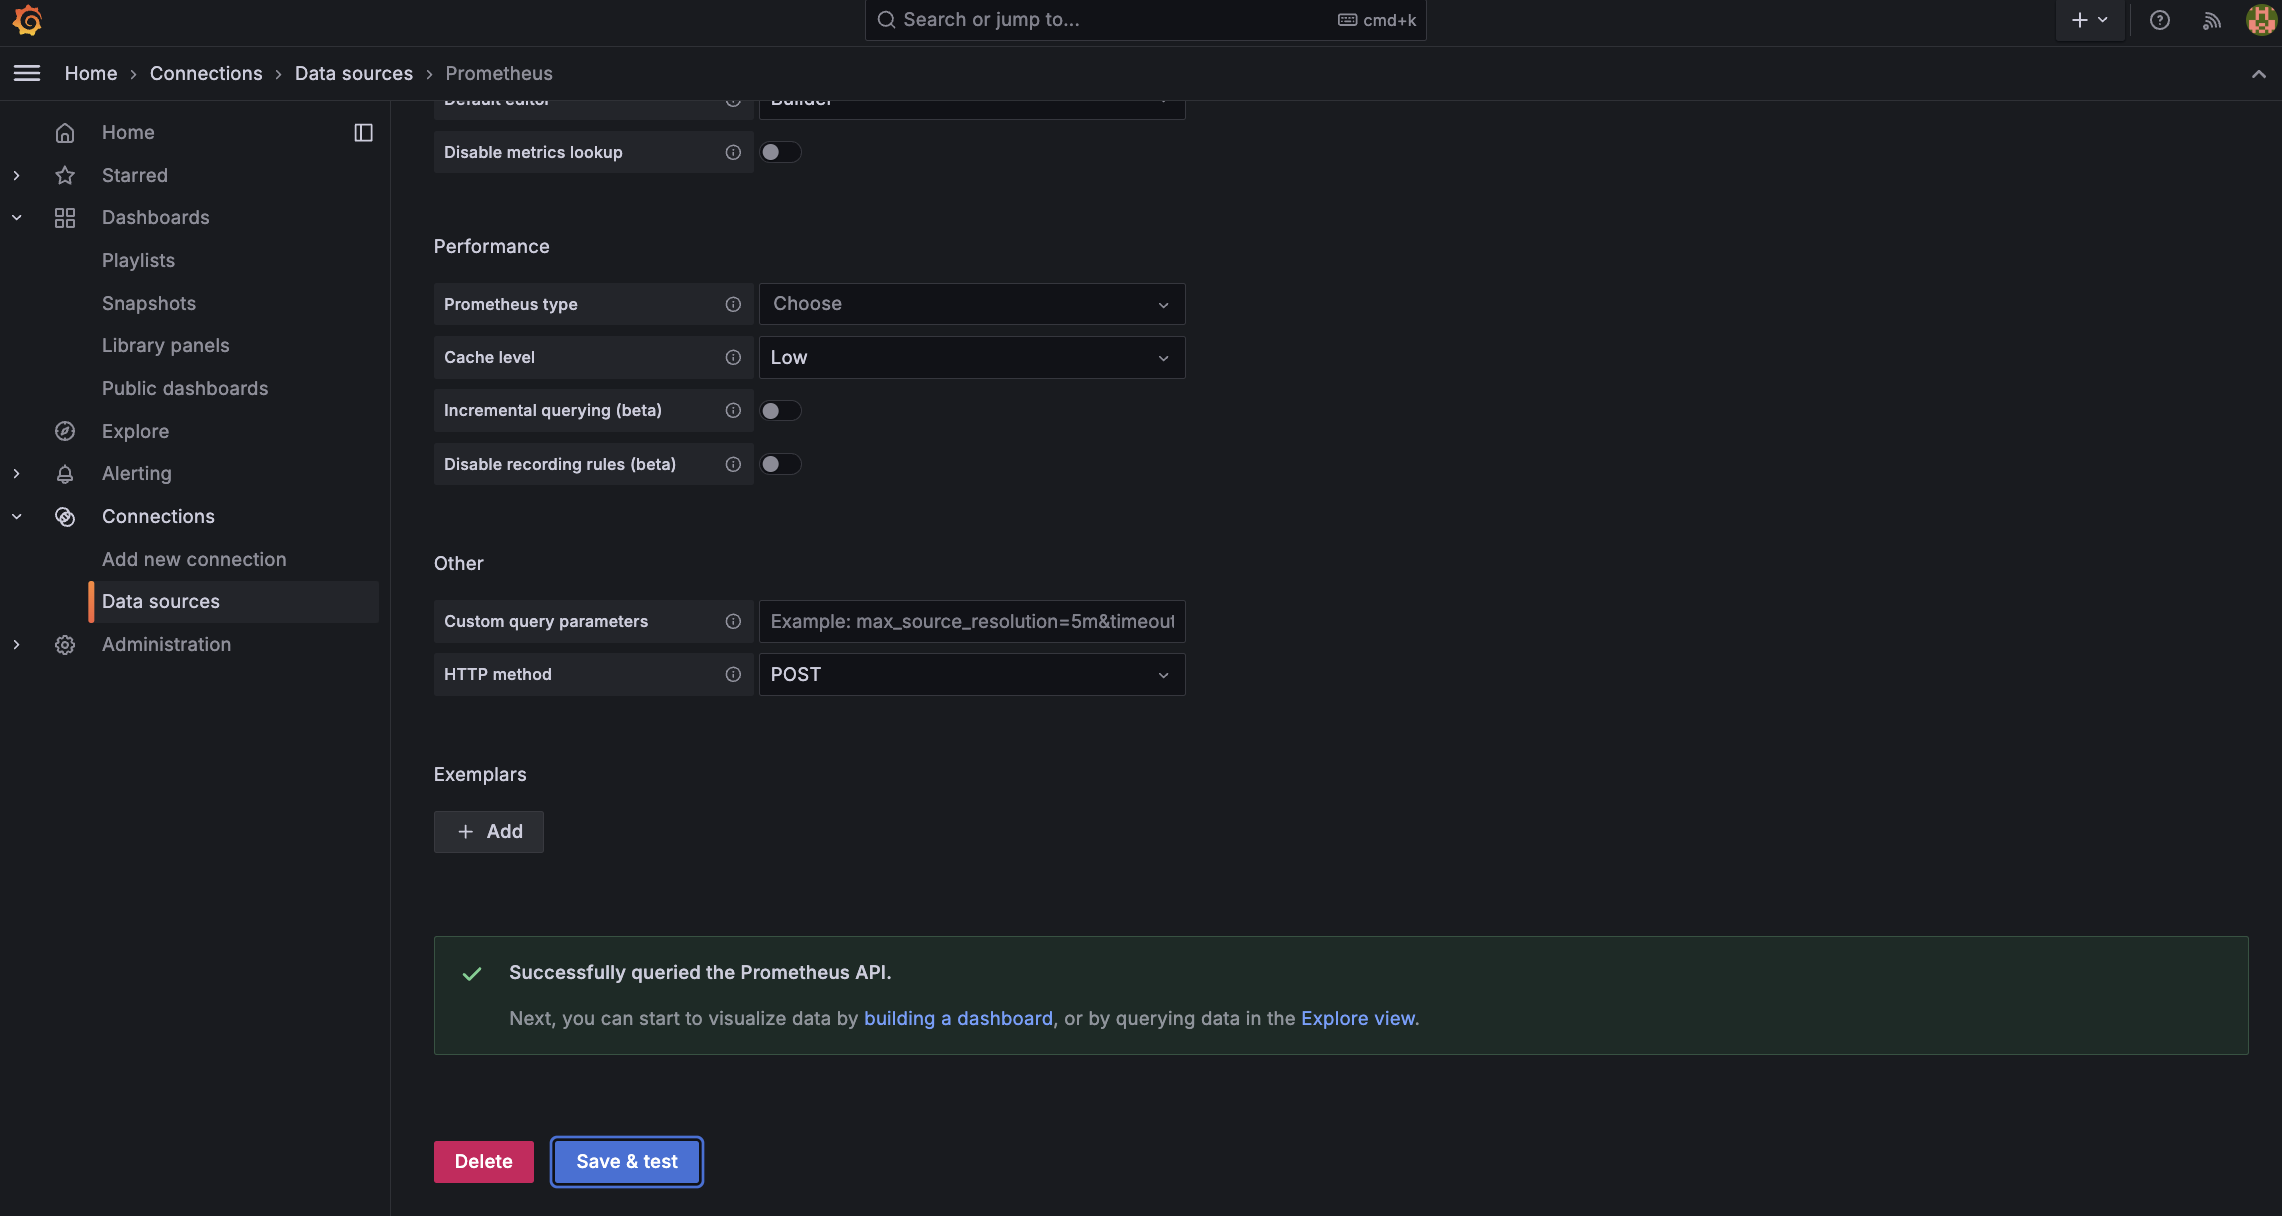
In the Grafana UI, click Connections → Data sources, and open the data source. Then click Save & test button to test the data source to make sure it can connect to the Prometheus server successfully.

Import the sample dashboard
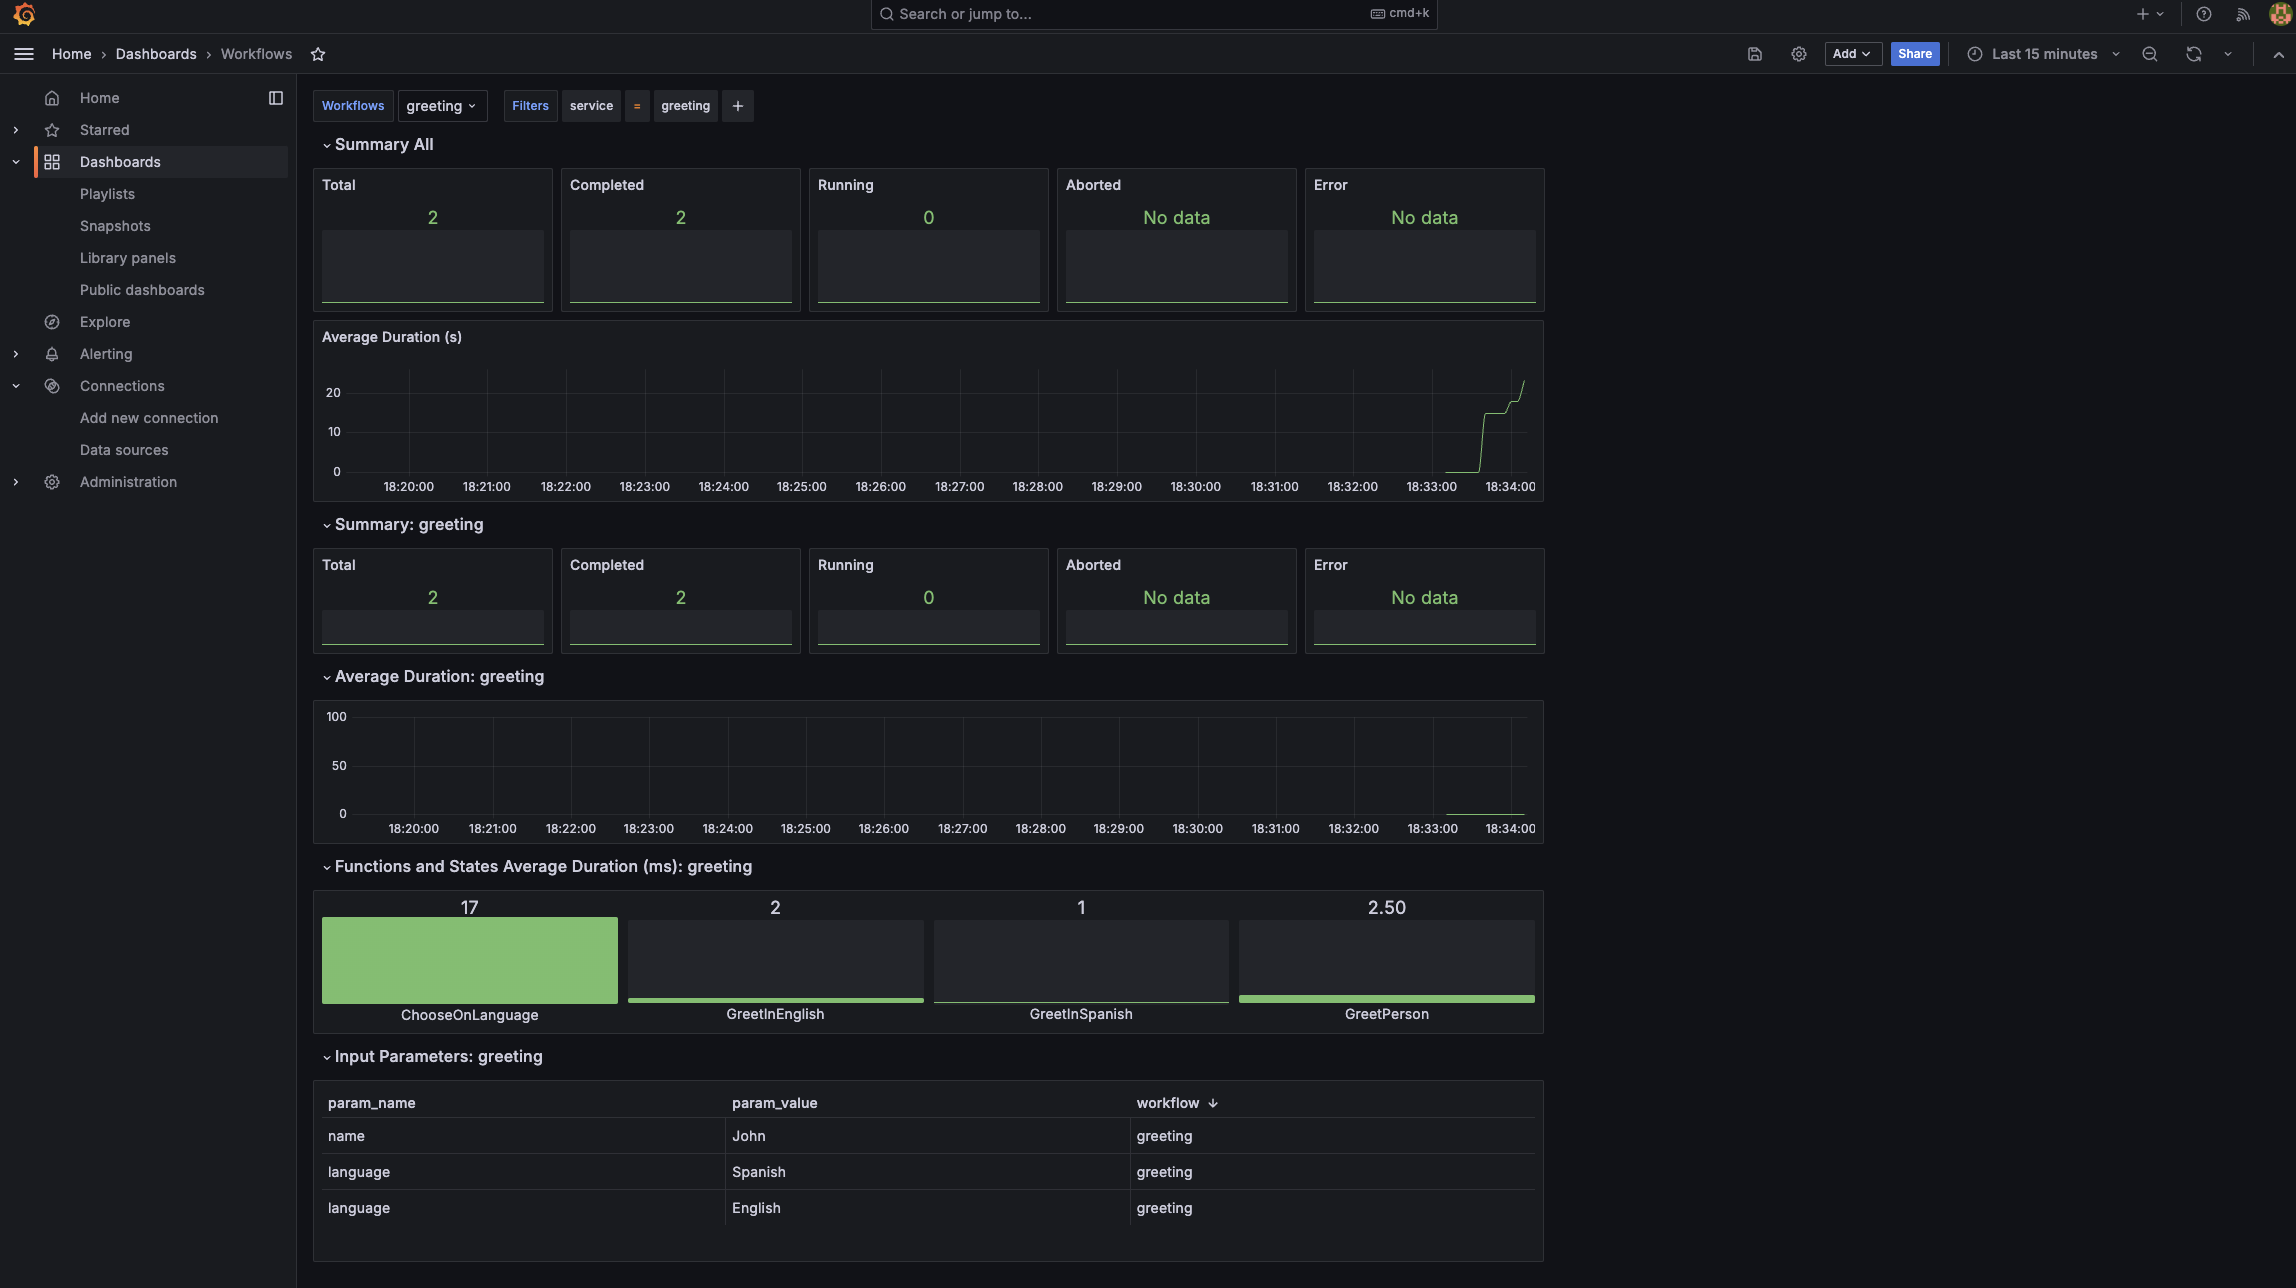
Click + → Import dashboard, copy the json model data for the sample dashboard and then paste the data in the Import via dashboard JSON model text box, and then click Load. The sample dashboard is loaded.

Customize or build your own dashboard
You can customize or build your own dashboard. For more information, see Grafana Dashboards and Prometheus Metrics for Workflows.
Found an issue?
If you find an issue or any misleading information, please feel free to report it here. We really appreciate it!