Dashboards in SonataFlow Dev UI extension
In SonataFlow Dev UI extension, the Dashboards page is used to display the available dashboard files. The page displays a list of available dashboards and add filters to the list.
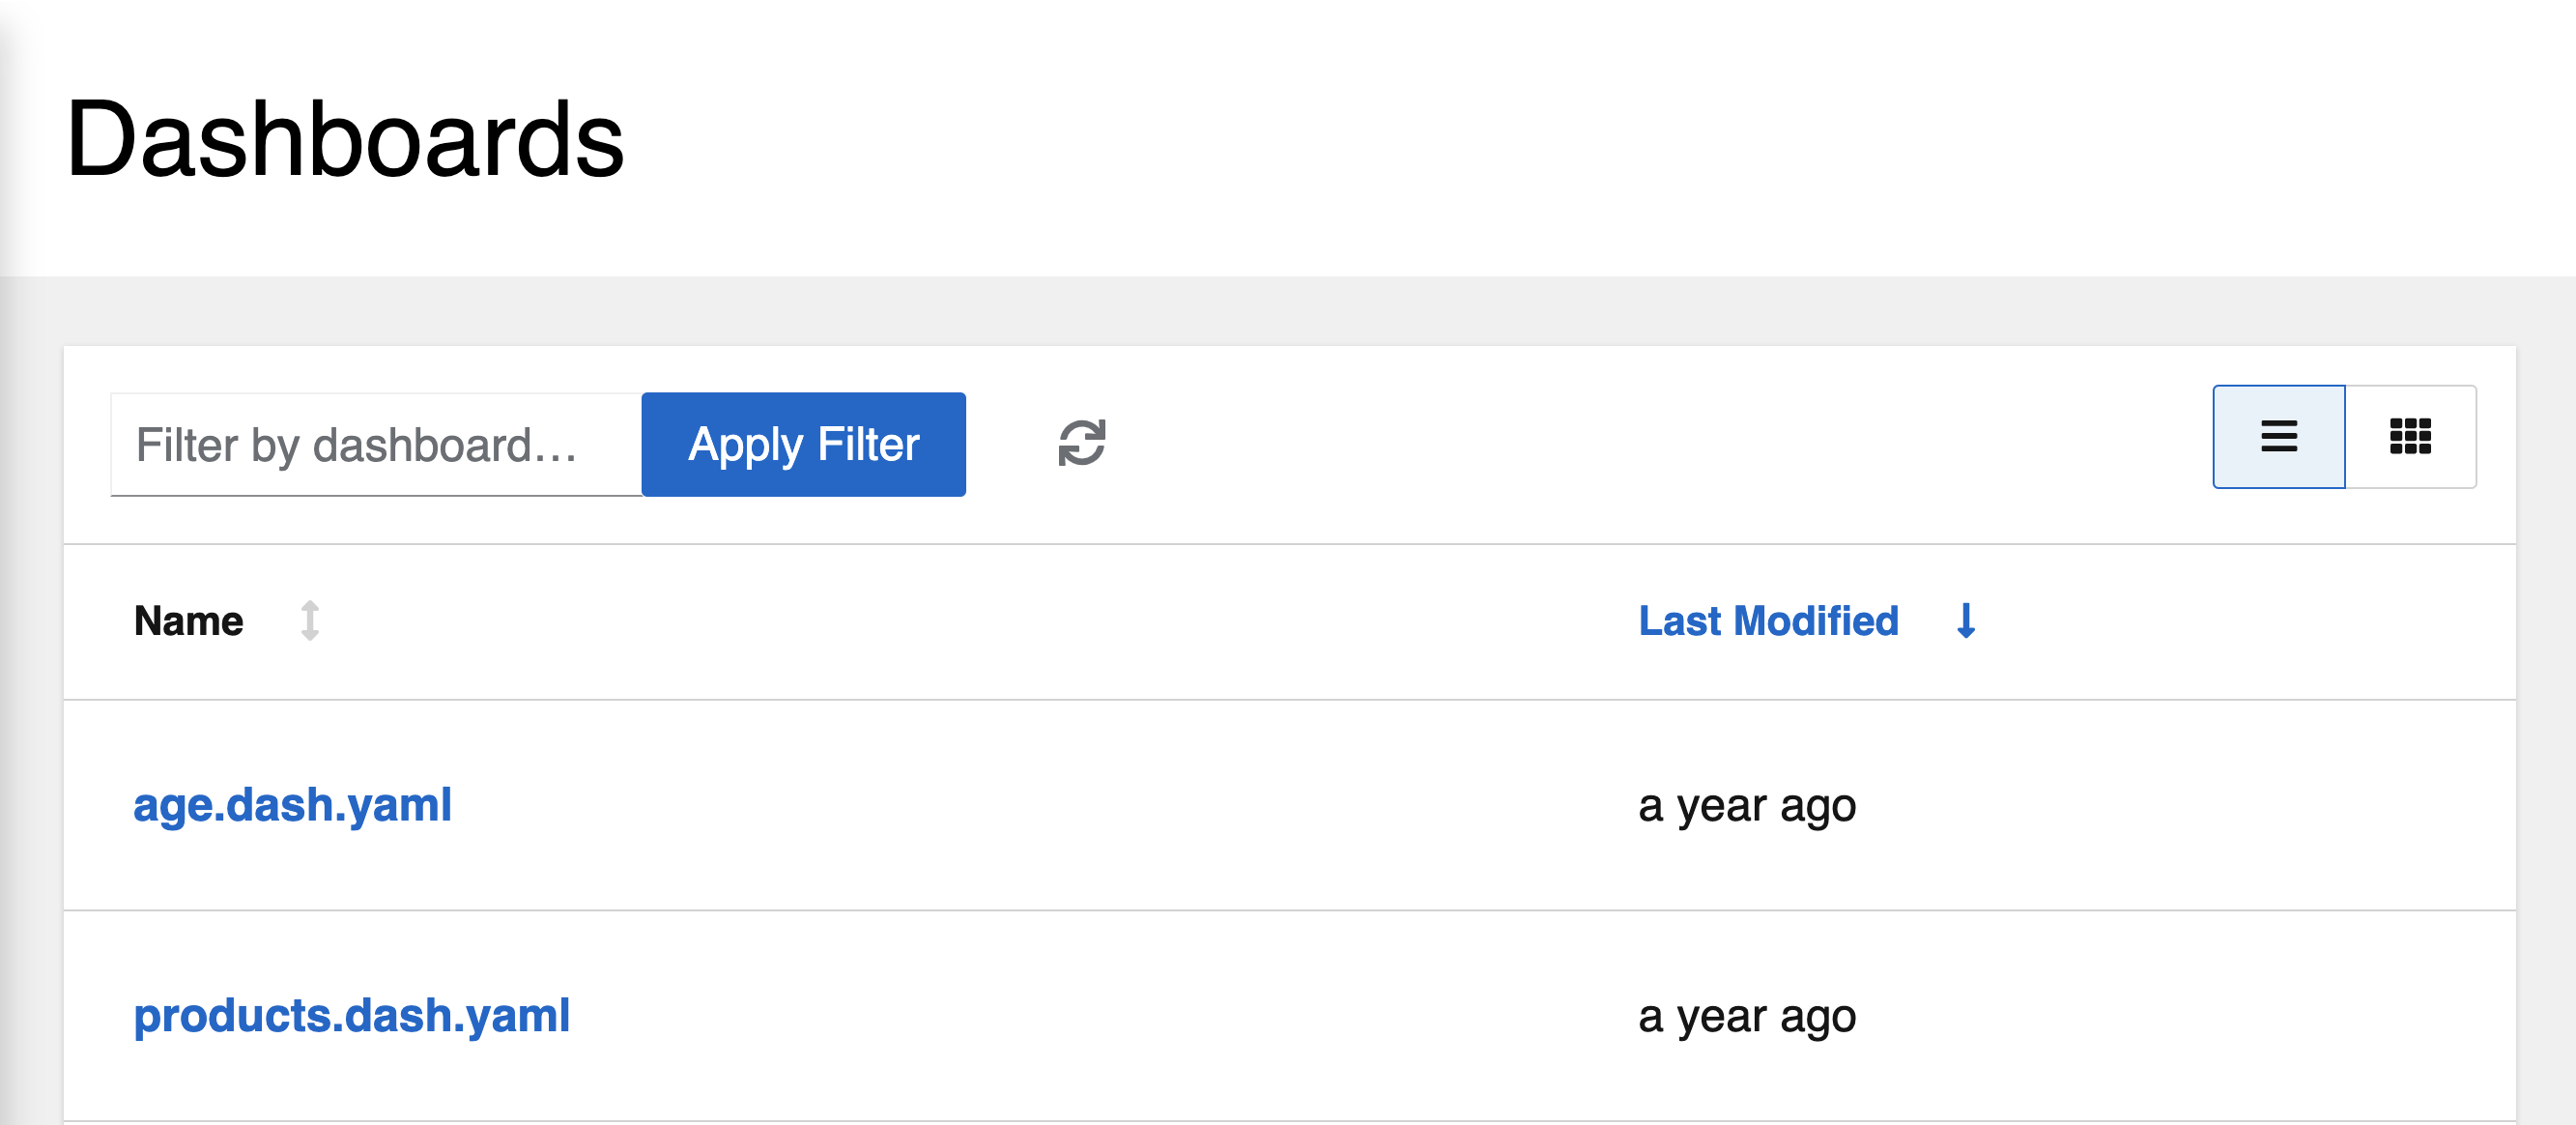
The table on the Dashboards page displays the following details:
-
Name: the name of a custom dashboard.
-
Last Modified: the time reference indicating when the custom dashboard was last updated.
Creating a custom dashboard
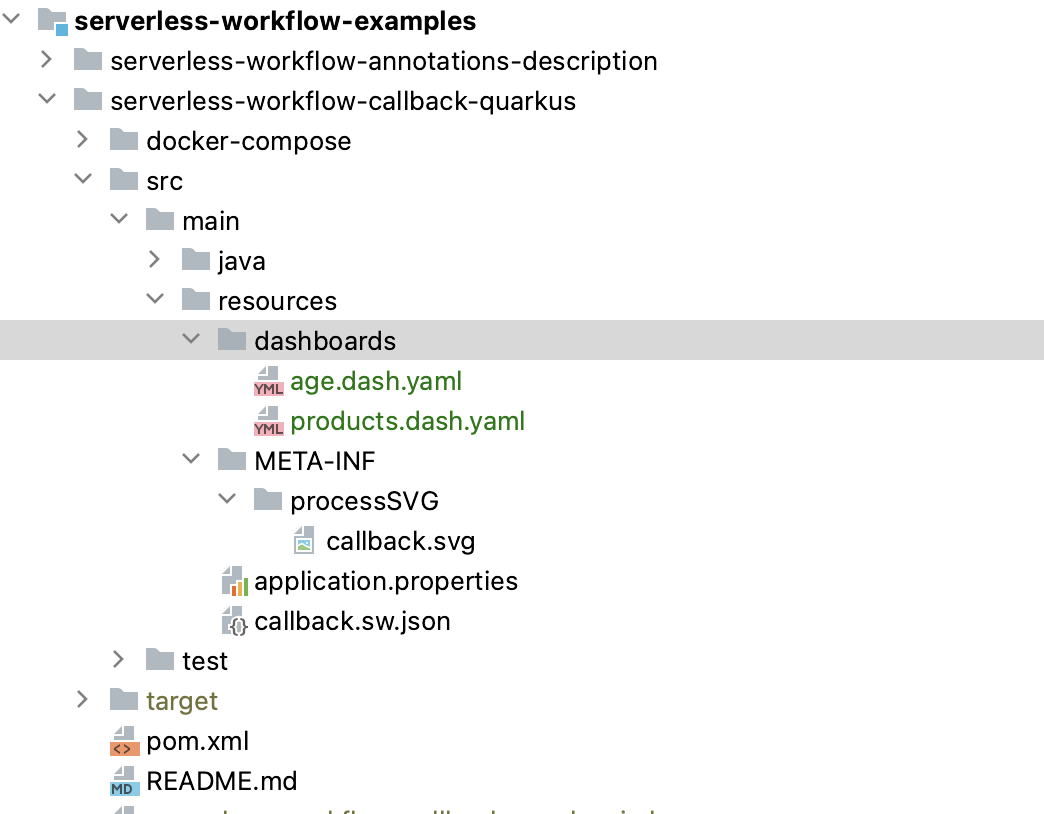
Create a custom dashboard file
See the dashboard guide for creating dashboards and visualizations with YAML. You can run all examples with Dashbuilder YAML Online.
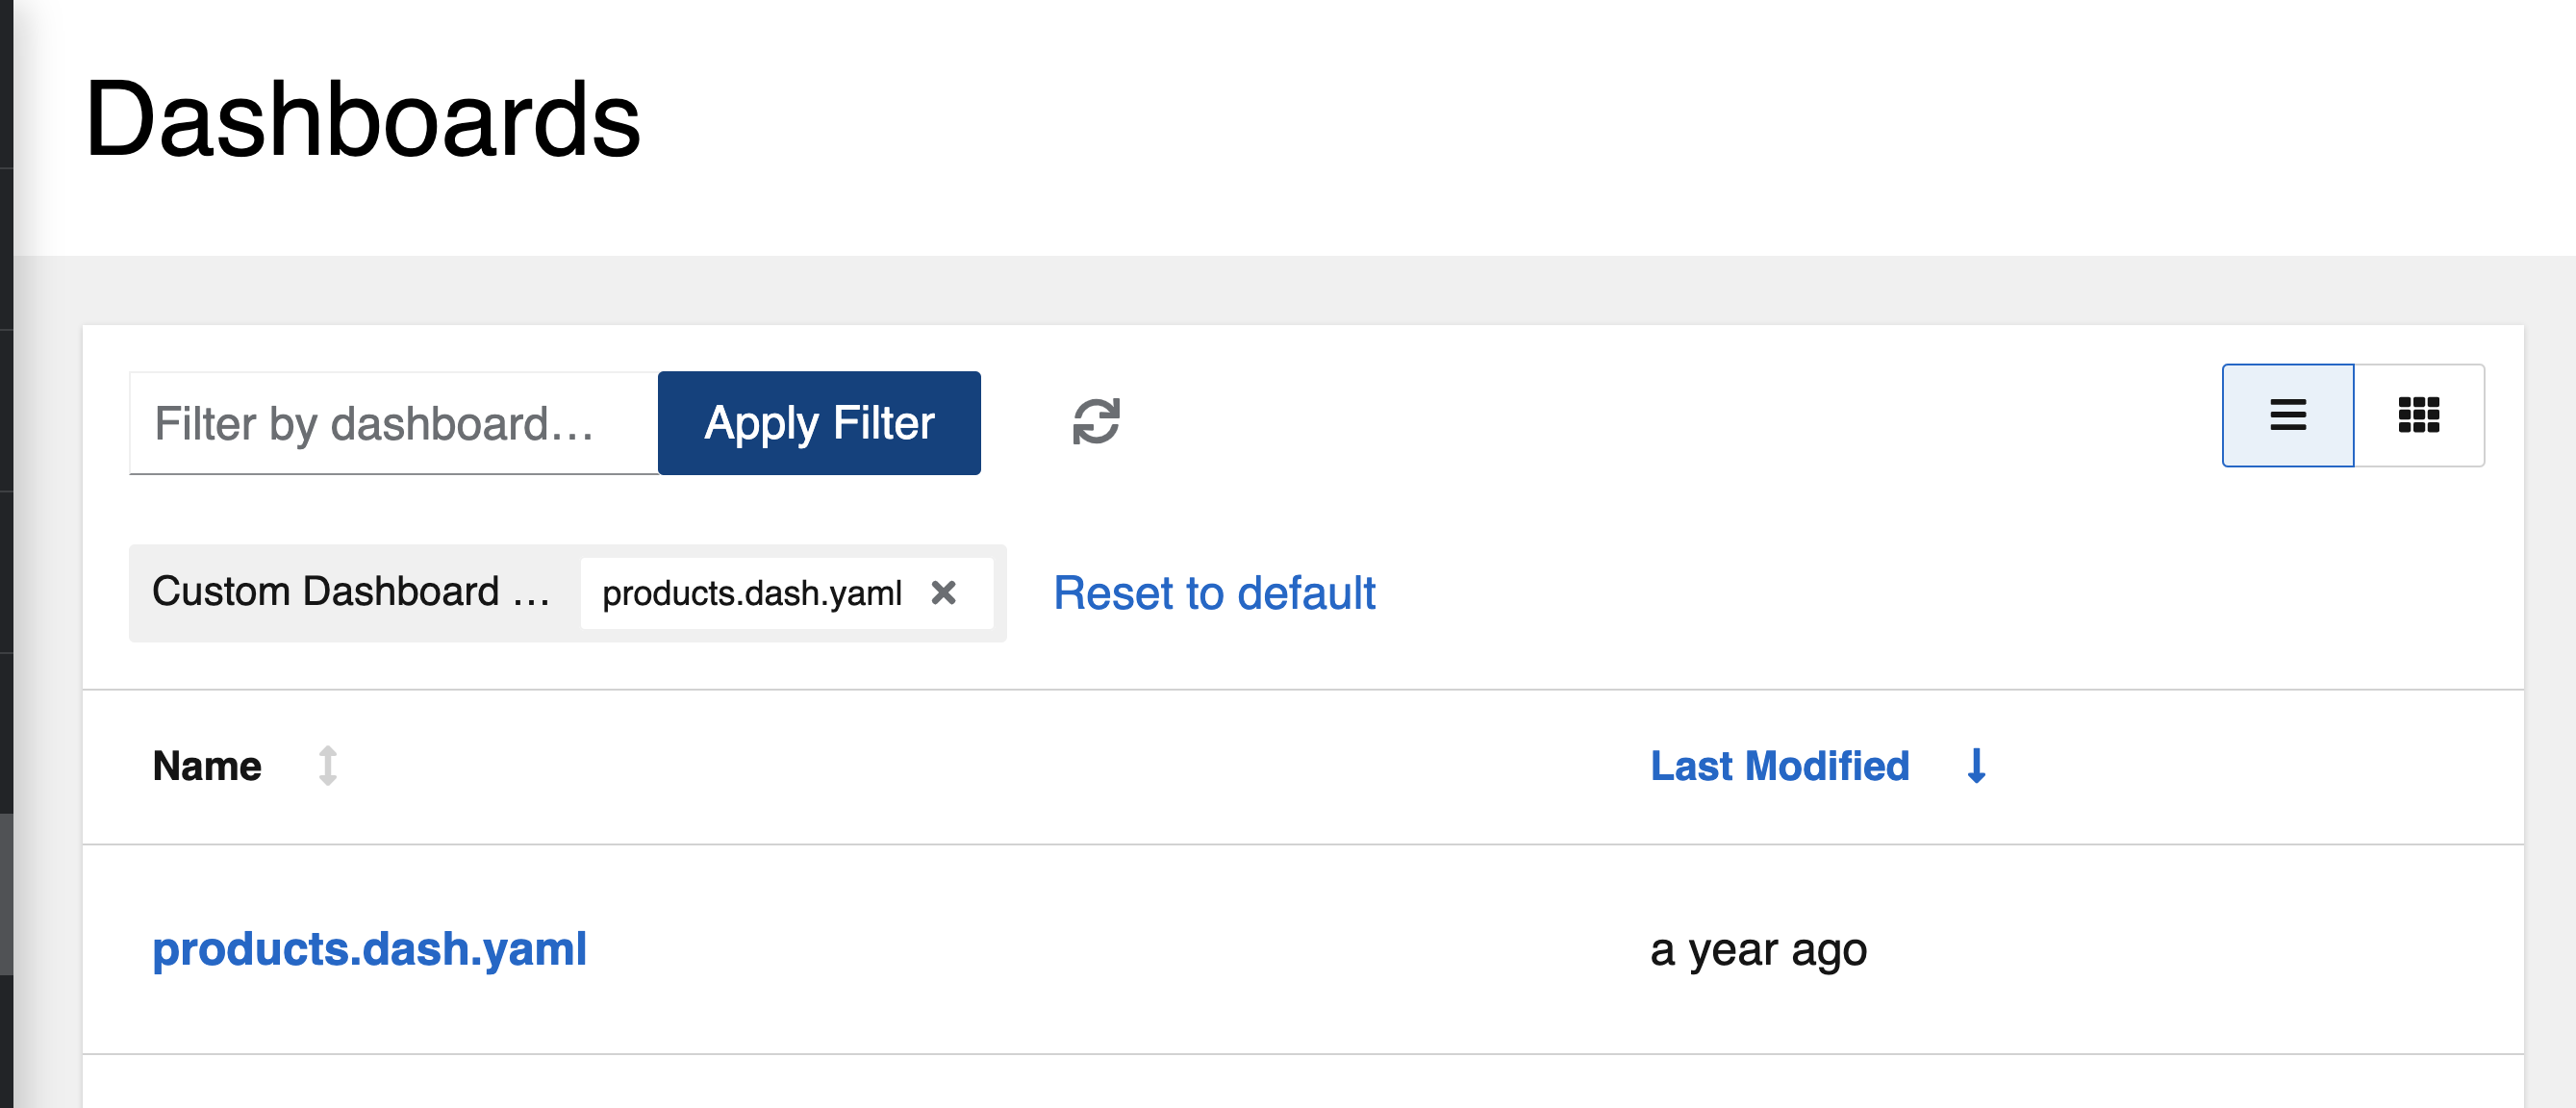
Filtering the dashboards
To filter the dashboard based on name, enter a name in the Filter by dashboard name field and click Apply filter button.
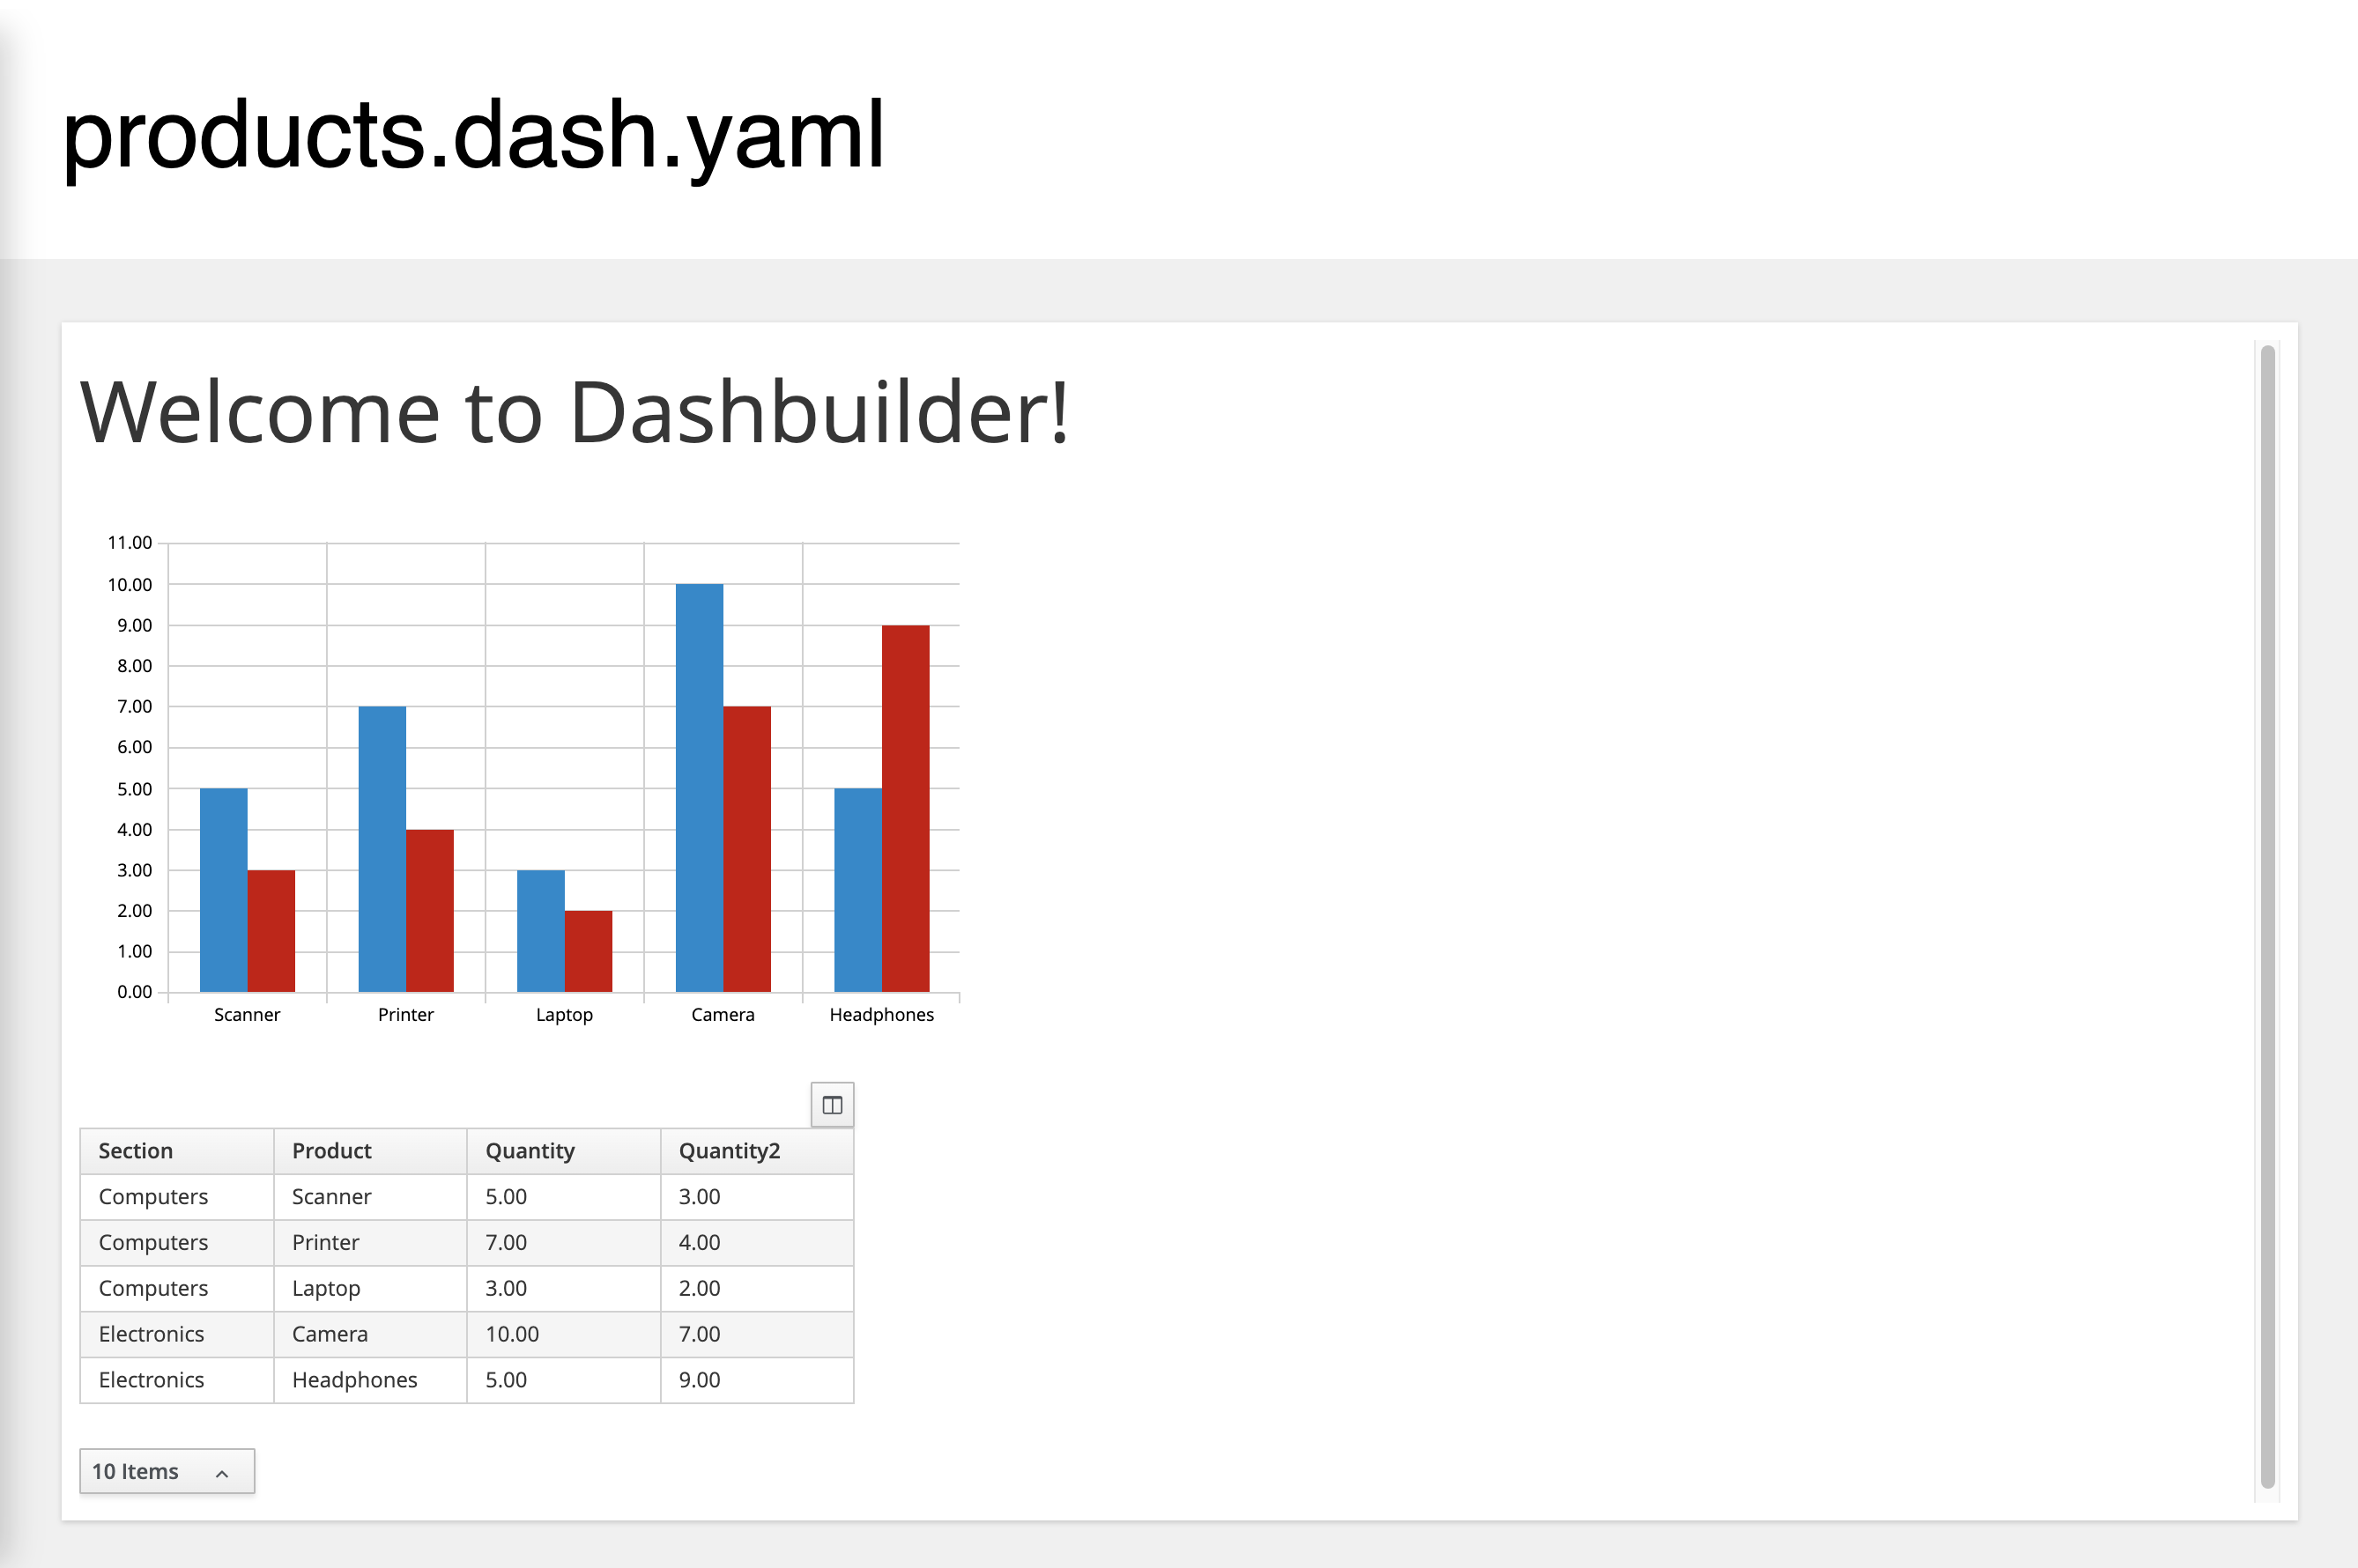
Accessing a dashboard details
In the dashboard table, the name column contains a clickable link, which enables you to navigate to the Dashboard Details page.
Found an issue?
If you find an issue or any misleading information, please feel free to report it here. We really appreciate it!